Understanding EV Charging Curves: Why EVs Charge at Different Speeds
Two electric vehicles can connect to the same EV charger and still charge at very different speeds. Why?
The answer is not just the power of the charging station. A major part of the explanation lies in the vehicle itself — and specifically in its charging curve.
What is an EV charging curve?
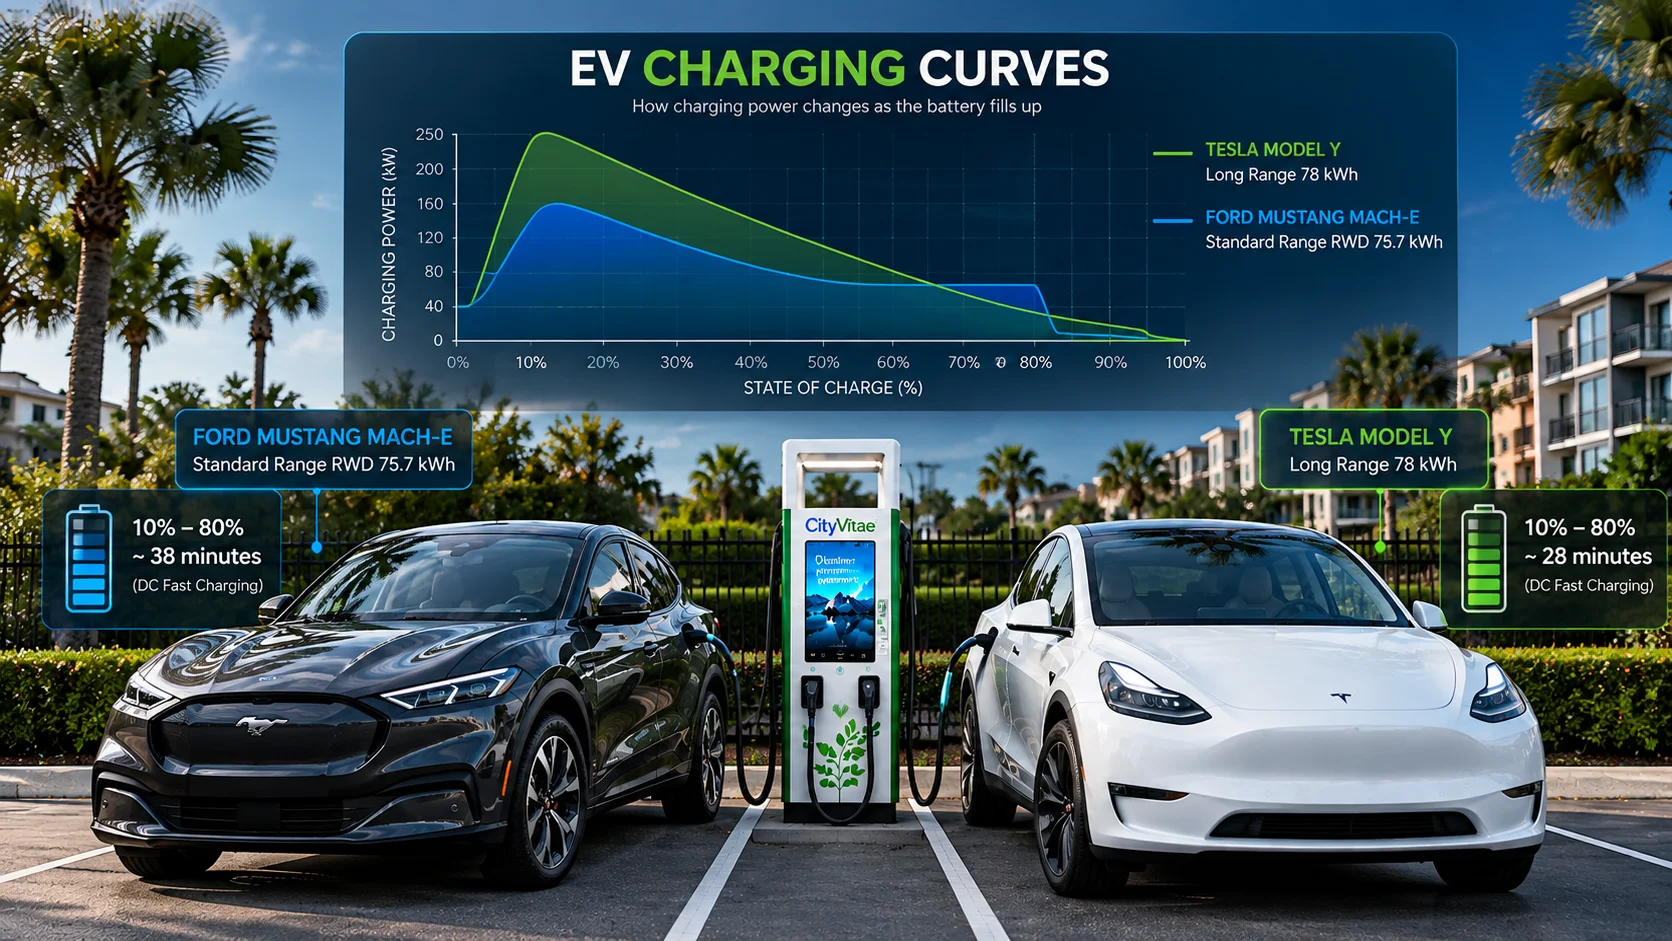
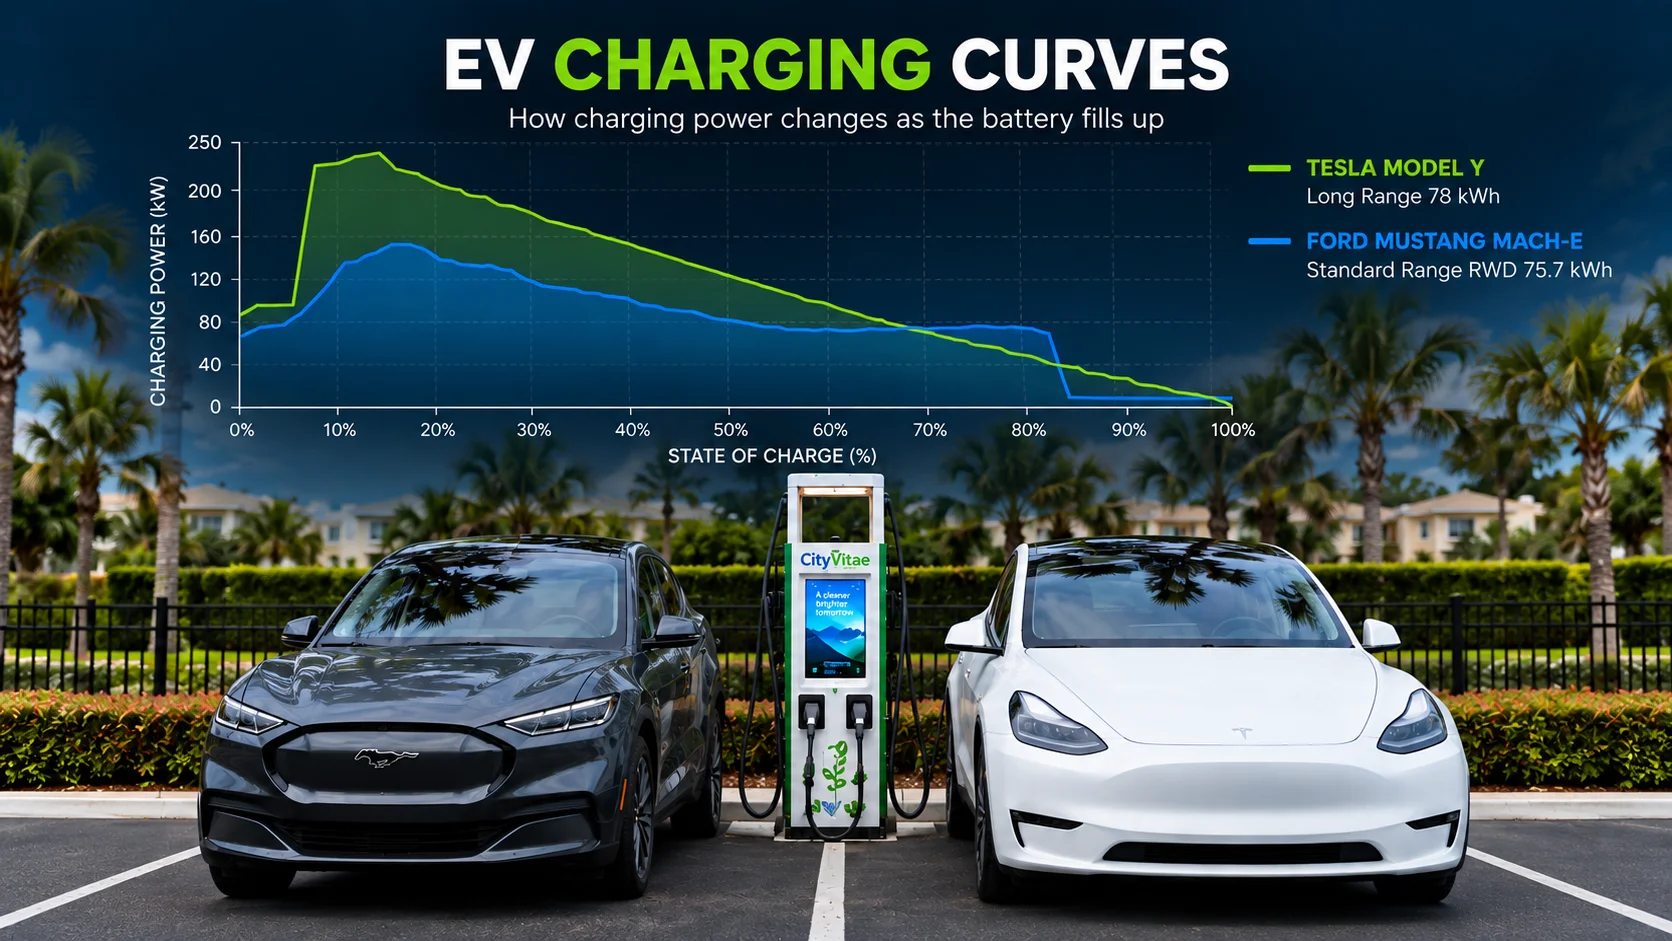
An EV charging curve shows how much charging power a vehicle accepts as its battery fills.
When an EV is connected to a DC fast charger, it does not necessarily draw the charger’s maximum available power throughout the entire charging session. Instead, the amount of power accepted by the vehicle changes depending on factors such as its battery level and the charging characteristics established by the vehicle and its battery management system.
On a typical charging curve, the horizontal axis represents the battery’s state of charge (SoC), from 0% to 100%, while the vertical axis represents charging power in kilowatts (kW).
The resulting curve allows us to visualize how quickly an EV can charge at different stages of the session.
Why does charging speed change as the battery fills?
EVs can accept high levels of power during certain portions of a charging session, but that power does not remain constant all the way to 100%.
As the battery fills, the vehicle progressively manages or reduces the amount of power it accepts. This is why charging power often begins to decrease at higher states of charge.
In practical terms, this also explains why the final portion of an EV charging session can take disproportionately longer than an earlier portion of the charge.
Same charger, different vehicle, different result
Charging curves are also vehicle-specific.
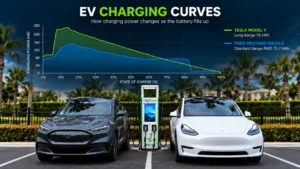
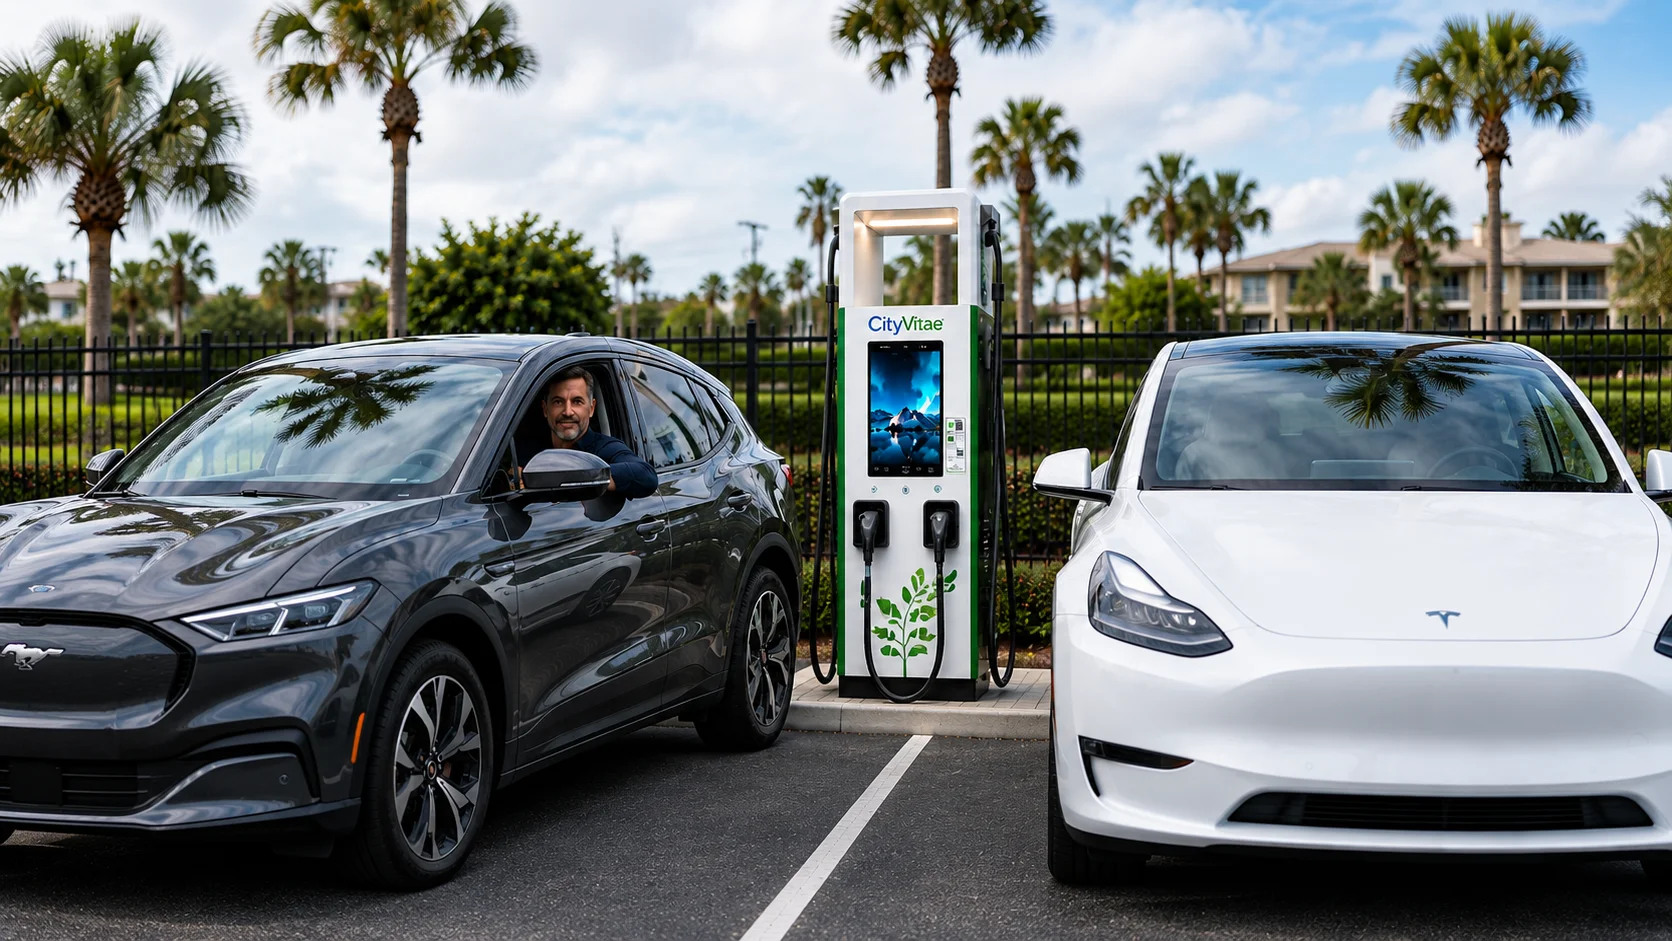
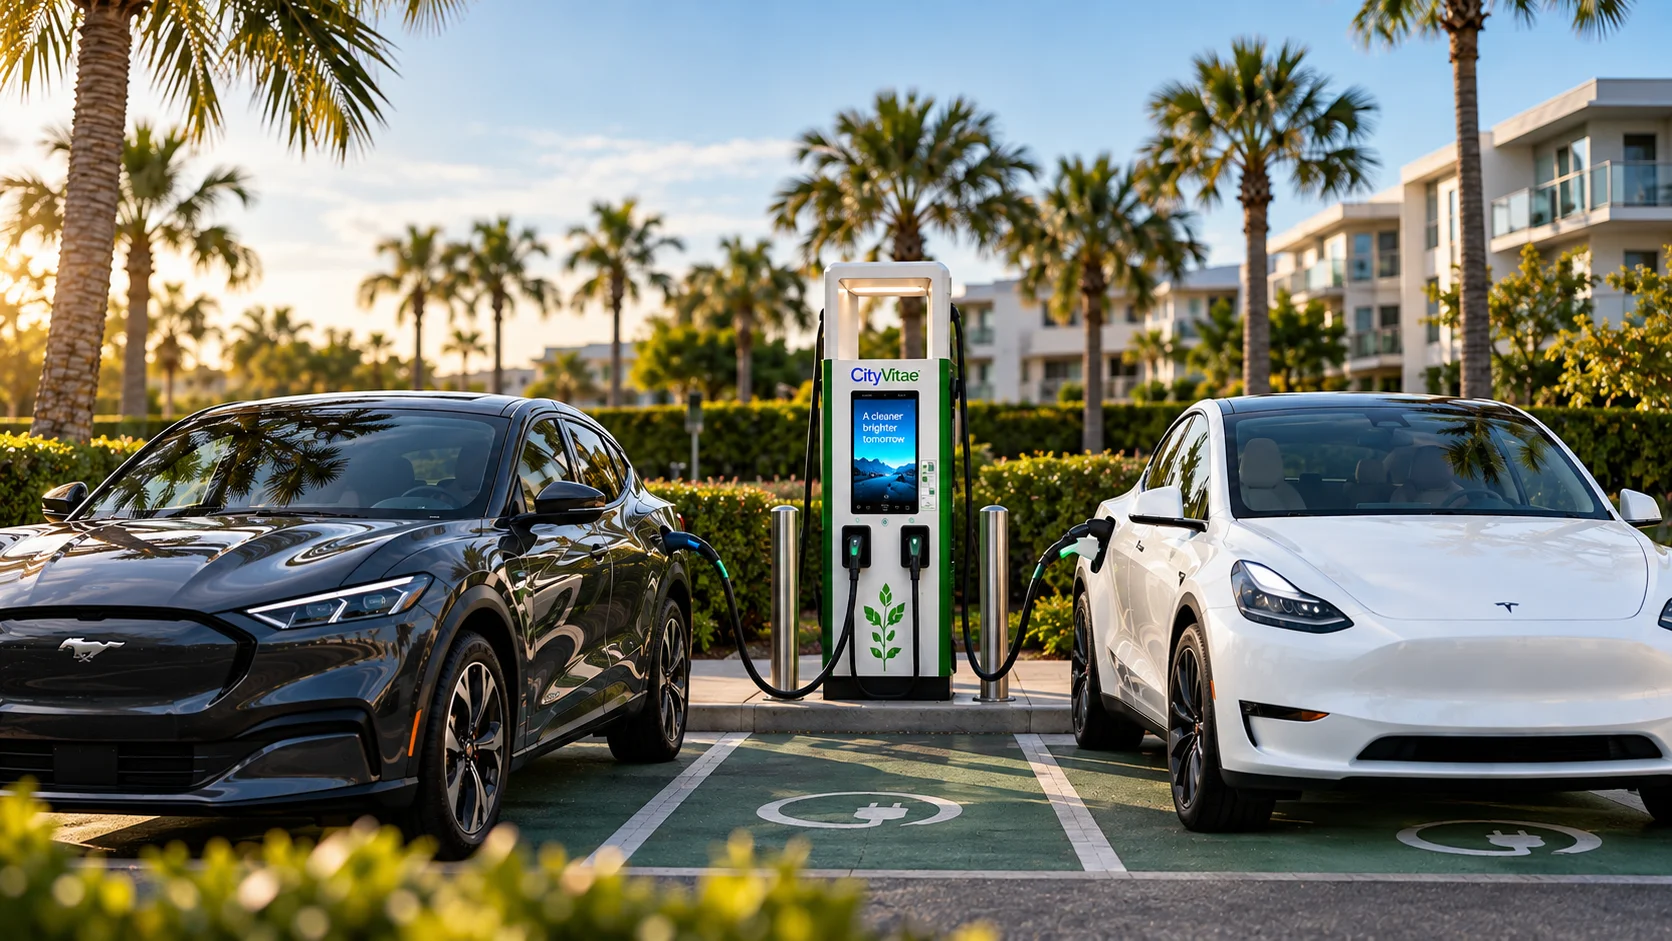
In our video, we compare the charging behavior of a Ford Mustang Mach-E and a Tesla Model Y.
The comparison makes an important point very easy to see: even when two vehicles have access to the same charging infrastructure, they do not necessarily use that available power in the same way.
The Ford Mustang Mach-E reaches a strong initial charging peak before its charging power gradually decreases. Later in the session, its curve shows a significant reduction in accepted power.
The Tesla Model Y follows a different pattern, reaching a higher initial peak before progressively reducing its charging power as the battery fills.
Looking at both curves makes it clear that maximum charging power is only one part of the charging experience. How long a vehicle can maintain higher power levels — and how its charging rate changes throughout the session — also matters.
Why do charging curves matter?
Understanding charging curves helps put advertised charging speeds and charger power ratings into context.
A high-powered charging station can make substantial power available, but the EV ultimately determines how much of that available power it can accept at any given point in the charging session.
That distinction is important when evaluating real-world charging performance and planning EV charging infrastructure.
Instead of looking only at a charger’s maximum kW rating, it is useful to understand the relationship between the charging station, the vehicle and the battery’s state of charge.
Watch: How EV charging curves work
In this CityVitae video, we break down EV charging curves visually and compare two different vehicles to show how charging power changes as their batteries fill.
At CityVitae, we develop EV charging solutions designed around real-world charging needs. Understanding how vehicles actually interact with charging infrastructure is an important part of building smarter, more effective EV charging environments.
Whether you are planning EV charging for a multifamily property, commercial location or com